The modeling behind Cornell’s successful fall semester and the engineers who skillfully crafted it
By Syl Kacapyr
“In God we trust. All others must bring data.” The words spoken by the late engineer and statistician William Edwards Deming imply the importance of translating data into information for decision making.
It is a notion that Cornell University understood as the fall 2020 semester approached. Whether or not to bring tens of thousands of faculty and students back to campus amid a deadly pandemic was a decision that could not be left to sheer judgement. It needed science.
Fortunately, the university is home to the School of Operations Research and Information Engineering, internationally recognized for its experts who use advanced analytical methods to help make better decisions.
“In late March, the world was turning upside down,” said Shane Henderson, the school’s Charles W. Lake, Jr., Professor in Productivity. “It was clear there were a lot of choices that the university was facing along with the rest of the nation, and we wanted to help. We knew that our ability to apply science to decisions could be important and we were trying to figure out how to have the most impact.”
The Duffield Hall Courtyard and other popular gathering places were empty in the spring and summer months of 2020 as Cornell began exploring if and when to reopen campus.
Faculty and students began thinking about logistical aspects of the pandemic, such as how to optimize transportation of ventilators needed to treat COVID-19 patients. But it was an interest in an epidemiological approach used in World War II to help curb the spread of syphilis that would eventually bring the school’s capabilities to the university’s attention.
What came next was a Herculean operation to mathematically simulate the months to come and inform university leadership of the best path forward, according to science. The results would capture the attention of the academic world and provide Cornellians with a semester they would never forget.
Pooled testing and a path forward
During World War II, an outbreak of syphilis among U.S. troops forced health officials to develop a creative solution to prevent its spread. Regular testing of every soldier would have been expensive and inefficient given testing methods at the time. Instead, multiple blood samples were pooled together to reduce the total amount of required tests.
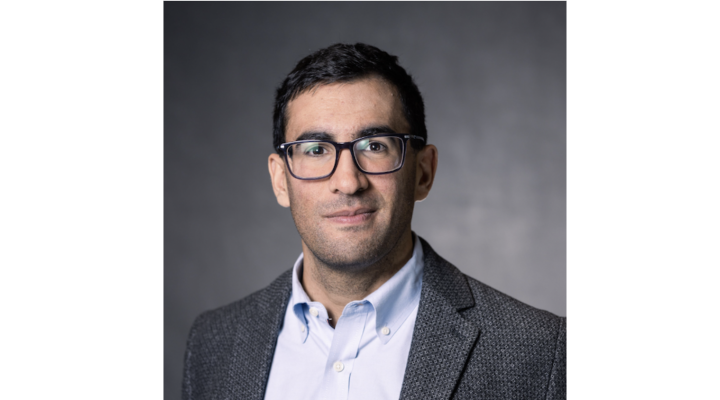
Peter Frazier, associate professor of operations research and information engineering, had taken an interest in this “pooled testing” technique, and envisioned its application for curbing the COVID-19 pandemic.
“We know most of the people we’re going to be testing will be negative, so what you can do in a situation like that is instead of testing each sample – each swab of the nose – individually, you dissolve those nose swabs into some fluid and run one chemical reaction in order to test for the presence of the virus,” said Frazier, who specializes in Bayesian optimization and simulation. “If it tests negative, you can rest assured that all who participated in that pool are negative. If it tests positive, then you do follow-up testing on each of the individual samples.”
As fate would have it, Cornell Provost Michael Kotlikoff had independently taken an interest in pooled testing, and began exploring the idea by contacting a close colleague of Frazier’s – David Shmoys, the Laibe/Acheson Professor of Business Management and Leadership Studies.
Clockwise from top left: Christopher Wofford of eCornell; Provost Michael Kotlikoff; Sharon McMullen, assistant vice president of student and campus life for health and well-being; Gary Koretzky, vice provost for academic integration; Diego Diel, Cornell COVID-19 Testing Laboratory; and Peter Frazier, associate professor in the School of Operations Research and Information Engineering, during the COVID-19 Summit, a 2-day event featuring researchers from across Cornell.
“I knew that Peter had been looking for an opportunity to work on developing pooled testing as a means to achieve regular asymptomatic screening on a national scale, but the possibility of helping Cornell would be a way to have a more immediate impact,” said Shmoys, who is also director of the Center for Data Science for Enterprise and Society. “I put Peter in touch with the provost, and this led to the formation of the Cornell Covid Modeling Team.”
Wondering if this technique could be a path forward to having in-person instruction during the pandemic, Frazier, supported by Henderson and Shmoys, launched a full-fledged effort to mathematically model Cornell’s options for the fall. What their simulation modeling revealed was a counterintuitive finding that was met with a healthy mix of curiosity, hope and skepticism.
Scouring the literature… and cruise ships
Working as part of a university committee to support decision making for university leadership, Frazier and his team enlisted the help of a talented roster of students. Their goal was to provide data-driven options as leadership considered whether and how to bring students back for an in-person fall semester.
“We thought quite hard about not opening Cornell and instead going to virtual instruction in the fall, but the challenge that we faced was there were a number of students who said they would come back anyway,” said Frazier, referring to a university survey in which 31% of respondents said they were likely to return despite virtual-only instruction. That translated to roughly 5,000 students. “We were worried that if students weren’t officially on campus, then the mechanisms by which Cornell could enforce testing compliance would essentially be voluntary.”
In order to determine which option would produce the fewest COVID-19 infections and, hence, be the safest, the team wanted to know how COVID-19 might spread among the Cornell and greater Tompkins County communities. To do this, they used a stochastic compartmental simulation, a type of mathematical model frequently used in epidemiology. The simulation tracks people based on the state of their disease – susceptible, exposed, infectious, symptomatic or recovered – and by length of time in each of those states. The population was compartmentalized into groups including undergraduates in high-density housing, undergraduates living off campus, graduate students, and faculty and staff.
“A simulation model is a representation of reality, where you try to mimic what would happen in real life,” said Henderson, “and you build in as many realistic assumptions as you feel like you need for the decisions you're facing.”
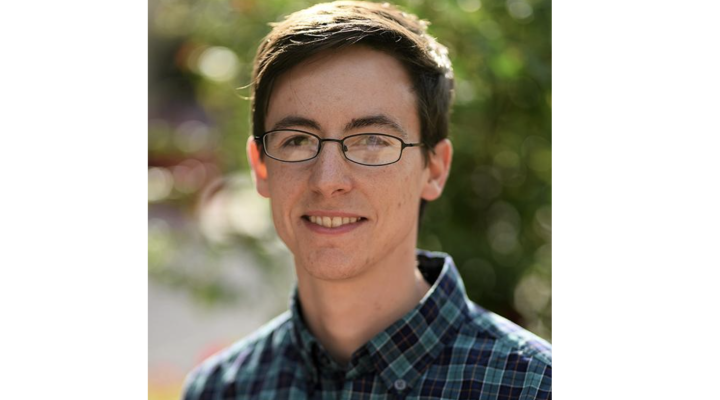
Simulating how Cornell’s entire semester might play out during a pandemic was a massive undertaking, recalled J. Massey Cashore, doctoral student in Frazier’s research group.
“The number of parameters in this kind of simulation becomes really huge – things like disease length, length of time it takes to incubate, how many contacts a person has per day. We were scouring the literature on COVID-19, trying to get these answers.”
Faculty and student engineers working to model Cornell’s COVID-19 protocols, from left to right; Top row: Jiayue Wan, Peter Frazier, Shane Henderson, David Shmoys; Middle row: Brian Liu, Alyf Janmohamed, Yujia Zhang, Robert Zhang; Bottom row: Anneliese Markus, Massey Cashore.
Knowing that models are only as good as the assumptions built into them, the group began searching the Centers for Disease Control and Prevention website for reports and statistics on the disease, which was still relatively new at the time. They were also contacting epidemiologists and other experts, trying to find as much data as they could to build their models.
“We cobbled together I don't know how many different sources, trying to get some estimates of infection and hospitalization rates as a function of age,” said Henderson. “In those early days, I think for the asymptomatic rate we saw estimates ranging from 20% to 85%. That's an enormous range.”
Another doctoral student, Alyf Janmohamed, found data from an unlikely, but helpful, source – cruise ships that experienced COVID-19 outbreaks.
“The ships had good, comprehensive data about whether or not passengers had COVID and whether or not they were asymptomatic,” said Janmohamed. “People in these data sets had vastly different ages, different races, and different geographies that we were stitching together to get our initial estimates of asymptomatic percentage.”
Added doctoral student Yujia Zhang: “In turn, we needed to apply that data to the different separation of the age levels we see on the Cornell campus. That was another set of parameters we needed to get, using enrollment data.”
In the end, the group’s model for infection rate was remarkably accurate considering what little information about COVID-19 was available at the time. They estimated that around 50% of COVID-19 patients are asymptomatic. Nearly a year later, the CDC has determined the rate to be roughly 40%.
The team’s effort continued. They needed more data.
Close contacts and Cashore’s coding
One of the most important numbers the group sought to model was the number of people that, on average, a single infected person could transmit the disease. They would have to consider the number of close contacts per day, the chance of transmitting the virus during those contacts, and the amount of time that person would be at large before being isolated.
Based on the scientific literature, the group expected individuals to have an estimated 8.3 close contacts per day.
“But we really had a lot of uncertainly about that number,” said Frazier, “and we knew if, in reality, the true number of expected contacts per day was much larger, then we would likely see much larger numbers of positive cases on campus. That’s a really dangerous thing we wanted to avoid and so that’s what kept me and a lot of us up at night.”
And there were other estimates that concerned the group, according to doctoral student Jiayue Wan.
“For instance, the accuracy of COVID-19 tests using different sampling methods – nasopharyngeal, oropharyngeal, saliva – and I remember that the team and I were reading dozens of papers that were fresh-off-the-shelf just to find evidence for one single parameter,” said Wan.
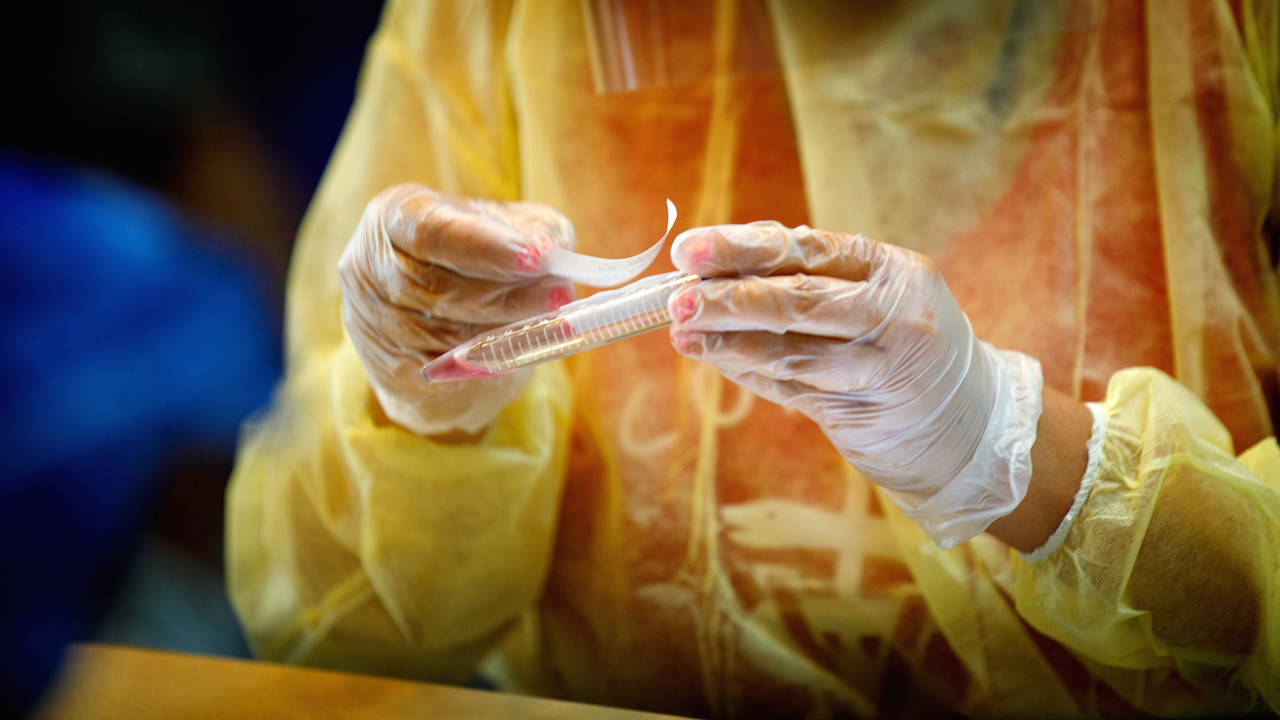
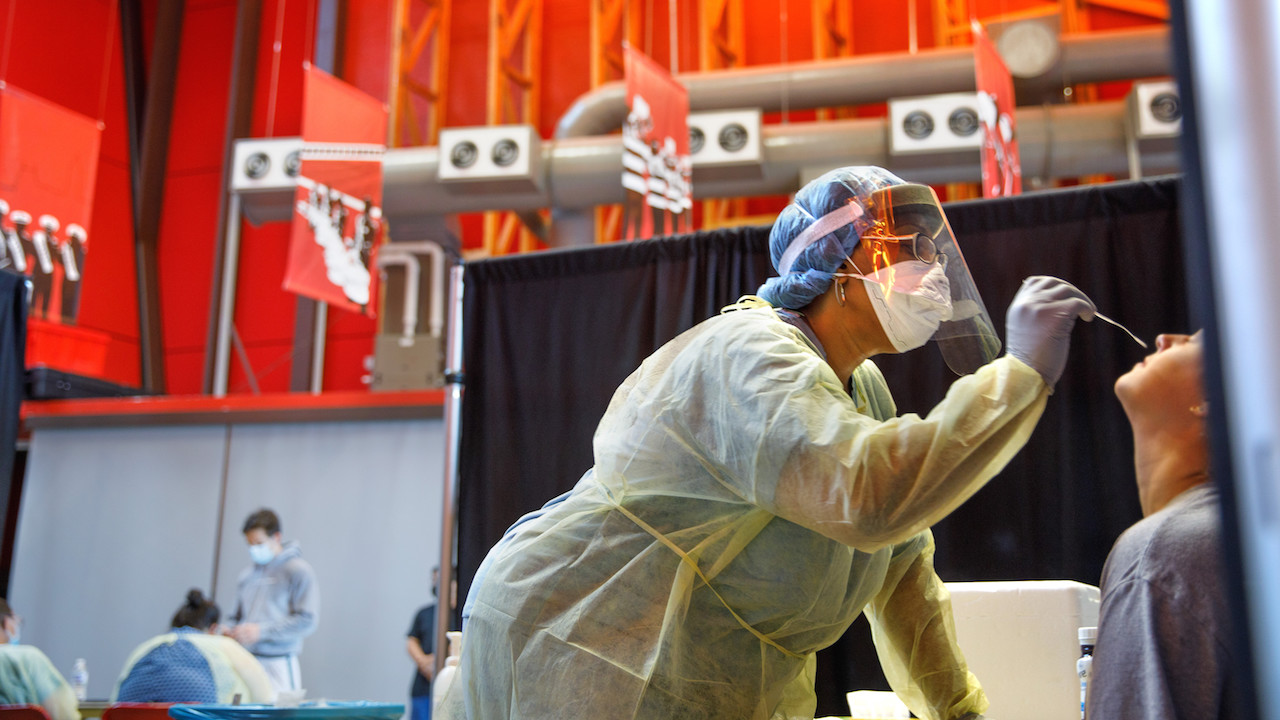
Test samples are processed at the Cornell COVID-19 Testing Lab.
To counter this and other uncertainties, the group performed sensitivity analyses in which they varied data parameters to see how the simulations would respond. If a simulation showed potentially dire consequences for small variations in the data, the group would use the most conservative estimates they had in order to be safe.
“We'd have a small change of the parameter settings, but it would launch an avalanche of additional work we had to do to rerun the set of simulations,” said Cashore. “By the end, we got really good at automating the sensitivity analysis runs, because this is something we had to do so frequently.”
There was a considerable amount of coding to be performed as the group continued to find information about COVID-19. More data. More simulations. Repeat. The main software script used to run the simulation models eventually reached about 700 lines of programming code, according to Cashore.
The group was closing in on a final simulation that would help inform university leadership which option – having an in-person or virtual-only semester – would be the safer option. But first, the group had to go back to where it all started – Frazier’s idea of pooled testing.
Moving heaven and Earth
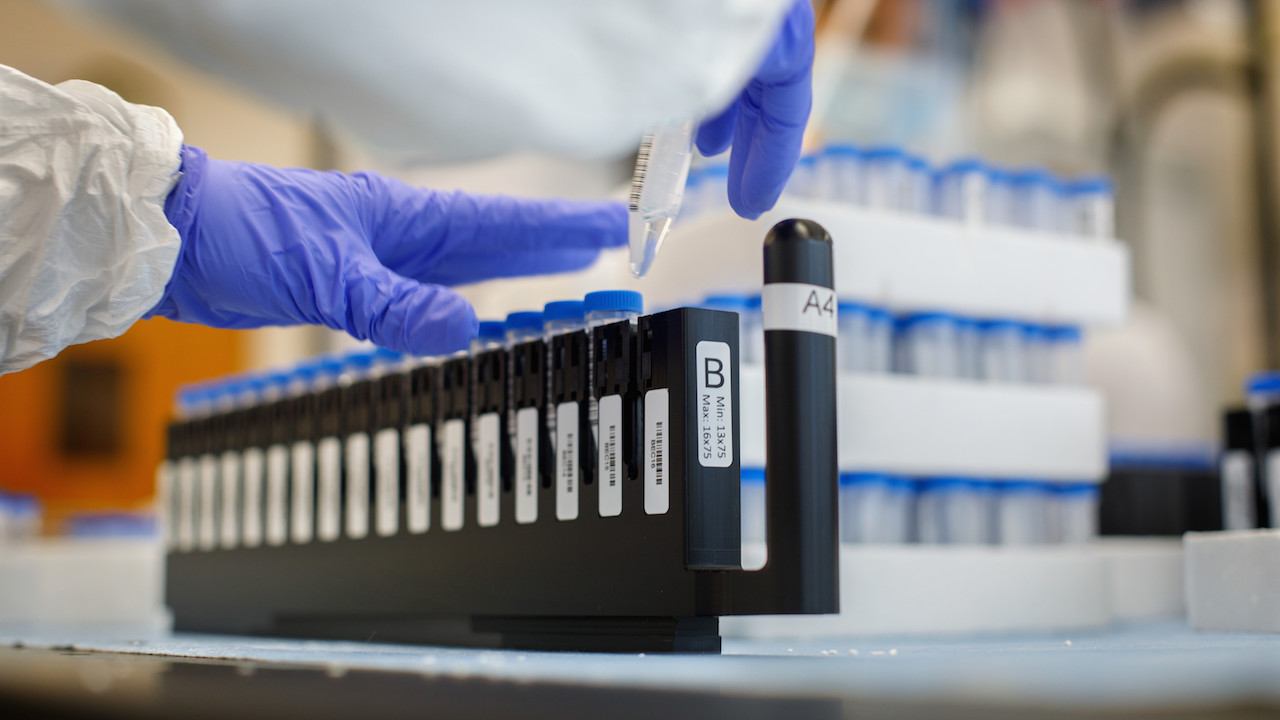
The cornerstone of Cornell’s ability to have in-person instruction amid the pandemic is the Animal Health Diagnostic Center at the College of Veterinary Medicine, home to the Cornell COVID-19 Testing Lab. The lab already had experience testing for COVID-19 in dairy cows, and university leaders wanted to know if it could be modified for screening the campus population.
A test sample is labeled at one of Cornell’s COVID-19 testing sites.
But because of the lab’s limited size, the goal for Frazier and the group was to find the sweet spot in which the number of daily tests would be within the lab’s limits, but enough to contain the spread of the disease on campus. So the group simulated different percentages of the campus population it might test each day, from zero all the way to everyone.
“Each run of the simulation produces a percentage of the population that becomes infected,” said Frazier. “What you see is that in most runs of the simulation, if I test everyone once every five days, I usually have about 5% of the population infected. If I don’t do asymptomatic screening, I often have as much as 50% of the population infected.”
Using this data, a number range that stood out to Frazier was 6,000 to 7,000 tests per day. The simulations showed that infections exponentially rise as the number of tests per day dip below that range, but as testing rises above that range, no dramatic shift in infection rates occurs.
And with Frazier’s pooled testing plan, screening 7,000 people per day would mean only performing about 1,500 tests – a measure that would make testing economically feasible.
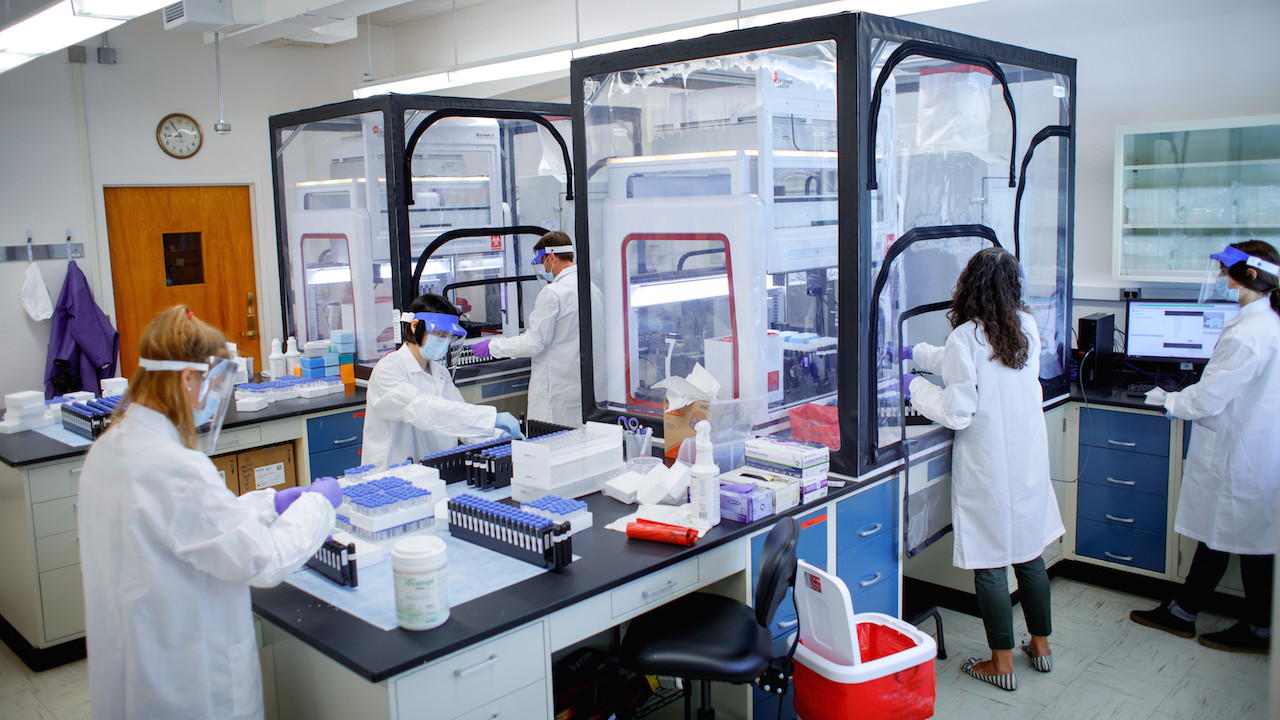
Staff process test samples at the Cornell COVID-19 Testing Lab.
“The testing lab moved heaven and Earth to get to that number,” said Frazier. “The people in that lab, every day they open 7,000 tubes by hand, and then they close 7,000 tubes by hand. They do that every weekday and then run 4,000 or 5,000 tests on Saturday and Sunday. We’re really appreciative of those people.”
More data. More simulations. More sensitivity analyses.
The work culminated in a 54-page report that the group published on June 15, 2020. In it, the modeling results suggested that a combination of contact tracing and pooled testing, among other measures, could achieve meaningful control over COVID-19 outbreaks on Cornell’s campus.
The report also detailed how the group’s simulations predicted that the number of infections for a virtual-only semester would be approximately 7,200 during a 16-week semester, while an in-person semester with the protocols recommended by the group would produce only 1,200 infections, an estimate that was later reduced to 900 based on refined models.
It was a counterintuitive finding, but it was one based on data and science. Having students on campus, according to the report, would enable testing compliance and other key factors in limiting spread of the disease. A virtual-only semester risked large outbreaks that would have endangered not just the Cornell campus, but the surrounding community in Tompkins County and beyond.
After reviewing the report, among many other considerations by university leadership, the decision was made – Cornell would have an in-person semester beginning Sept. 2.
The moment of truth
The anticipation. That’s what Henderson remembers most about the start of the fall semester. The anticipation of whether or not the simulation models would accurately reflect reality. After all, epidemic modeling is fundamentally imperfect, as the group’s report stated, and it was impossible for their models to fully capture the intricacies of the real world.
“Everybody was watching,” said Henderson. “We put in a lot of effort to try to make the estimates conservative, but accurate. But at the end of the day, there’s going to be some uncertainty.”
One of the main parameters the group was watching was testing compliance, according to Janmohamed.
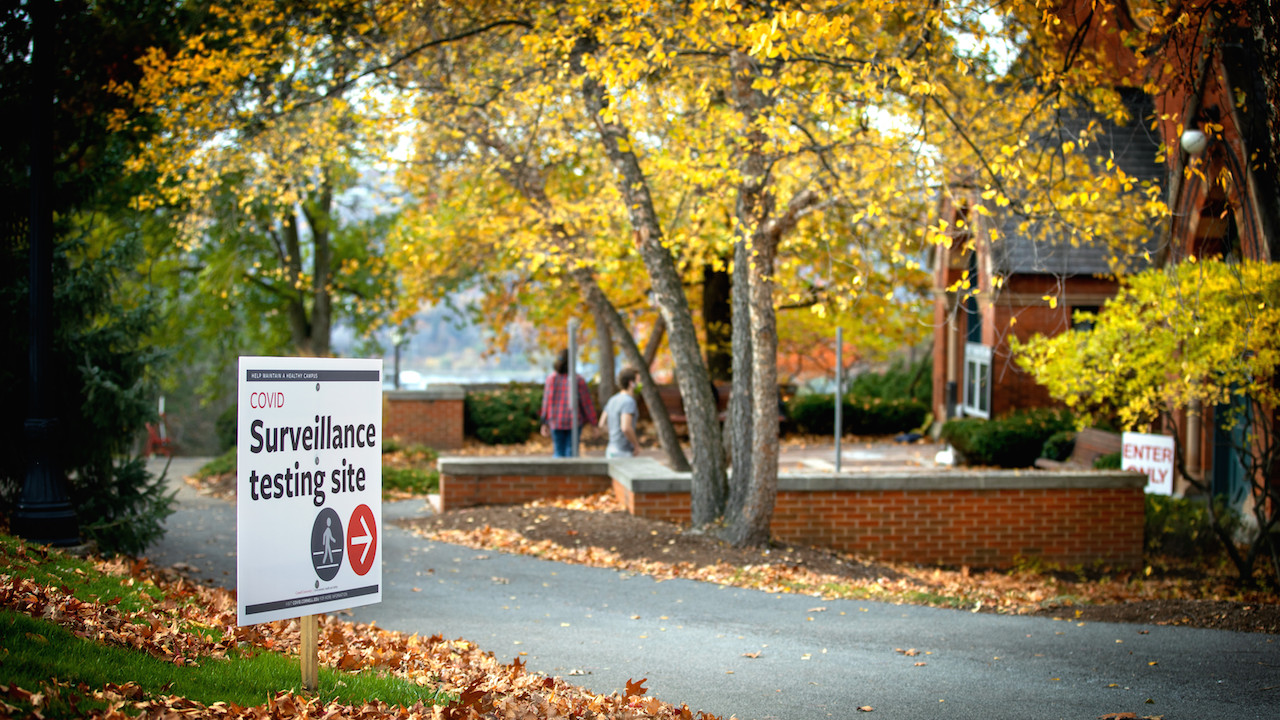
A sign points toward one of Cornell’s COVID-19 surveillance testing sites in Sage Chapel.
“Everyone had been in quarantine for five, six months at that point and it was hard to predict what people were going to do when they came back to campus and had a little bit more freedom,” said Janmohamed. “But seeing the way that Cornell students took it upon themselves to follow the social distancing guidelines and make sure the semester went well, it was really inspiring to see.”
As it turned out, Cornell saw a 97% compliance rate with its testing protocol. But before regular testing could begin in earnest, cases began to spike. By Sept. 4, the university saw a new high of 14 cases in one day, adding to the 24 cases it had seen the previous two days.
“During this period, there were clusters of cases that started in off-campus apartments,” said Frazier, “and when the asymptotic screening started, that’s when we found all the cases. This was a scary period, but over the course of about a week and a half, we were able to drive down this cluster.”
On Sept. 13, the university reported its first day with zero new cases. That was followed by two consecutive days of no new cases, and through the end of October the university was finding three or fewer cases per day.
Cornell’s success gained national attention. Some universities began modeling their protocols after Cornell’s, while many of those that didn’t were experiencing outbreaks. In the case of Michigan State University, the county in which it resides saw a major jump in infections despite the university not opening its campus – 640 cases one week in September. It was exactly what Frazier and others had feared for the Ithaca community had Cornell not opened its campus.
Beating the models
By the end of October, Cornell had reported a total of 155 COVID-19 cases, much fewer than the 900 Frazier and team had estimated in their report.
Frazier attributes the discrepancy to a number of factors, including the conservative data the team used out of an abundance of caution, and a lower prevalence of the disease among students returning to campus, likely due to a high compliance to the university’s request to quarantine before leaving.
“I really do believe – and I’ve seen the data – that students at Cornell are doing a much better job at complying with social distancing and masking restrictions as compared to other universities,” said Frazier. “I think that’s a big part of why we’ve had success – because our students are great, but also because of a number of innovations that the administration put in place and designed quite effectively.”
A test sample is taken at Cornell’s COVID-19 testing site at Fischell Band Center.
Another reason infections were much lower than the models predicted was because of adaptive testing, according Frazier. Adaptive testing is the concept of testing everyone in the social circle of an infected individual, not just those identified through contact tracing.
“For example, if a student who is on the wrestling team tests positive, we would test the entire wresting team. If a student who lives in a dormitory tests positive, we would test all people who share a bathroom with that student,” said Frazier, who also points to Cornell’s strong partnership with Cayuga Health System and the Tompkins County Health Department as reasons for the successful fall semester.
Never losing hope
Based on lessons learned from the fall and new challenges that have emerged during the pandemic, university officials have made adjustments to its policies and protocols for the spring semester. But for the most part, the spring is mirroring the fall – a semester backed by data, science, operations research and information engineering.
“There’s an introductory course I always start by presenting a few applications of what operations research can do,” said Shmoys. “This year was so completely different – in a few minutes one could explain the broad outlines of how mathematical modeling enabled the students to be on campus, taking this class in person.”
For all their hard work – the all-nighters, the seemingly endless modeling and coding, the thoughtful approaches and careful attention to detail – the faculty and students from the School of Operations Research and Information Engineering said there was just as much in it for them as everyone else.
“It's been a fantastic experience working with such incredible people, pouring their heart into this. I think it's been the highlight of my academic experience,” said Janmohamed. “In terms of personally dealing with the pandemic, going through this exercise of how you control the virus was something that helped me process everything that was going on.”
Zhang added: “It's the sense of control that we are building up, and in a more abstract sense, it's never losing hope. We know that the efforts we make actually contribute to making the situation better, at least in the scope of the Cornell campus.”
Acknowledgments
The School of Operations Research and Information Engineering would like to recognize the following faculty, students and administrators who contributed to the modeling efforts, in no particular order:
Peter Frazier, associate professor of operations research and information engineering
Shane Hendersen, Charles W. Lake, Jr. Professor in Productivity
David Shmoys, Laibe/Acheson Professor of Business Management and Leadership Studies
Massey Cashore, graduate student
Ning Duan, graduate student
Alyf Janmohamed, graduate student
Brian Liu '20
Jiayue Wan, graduate student
Yujia Zhang, graduate student
Anneliese Markus '23
Kate Ghezzi-Kopel, health sciences and evidence synthesis librarian
Lorin Warnick, Austin O. Hooey Dean of Veterinary Medicine
Gary Koretzky, vice provost for academic integration
Casey Cazer, assistant professor of epidemiology
Kristina Ceres, graduate student
Yrjo Grohn, professor of population medicine and diagnostic science
Renata Ivanek, associate professor of population medicine and diagnostic science